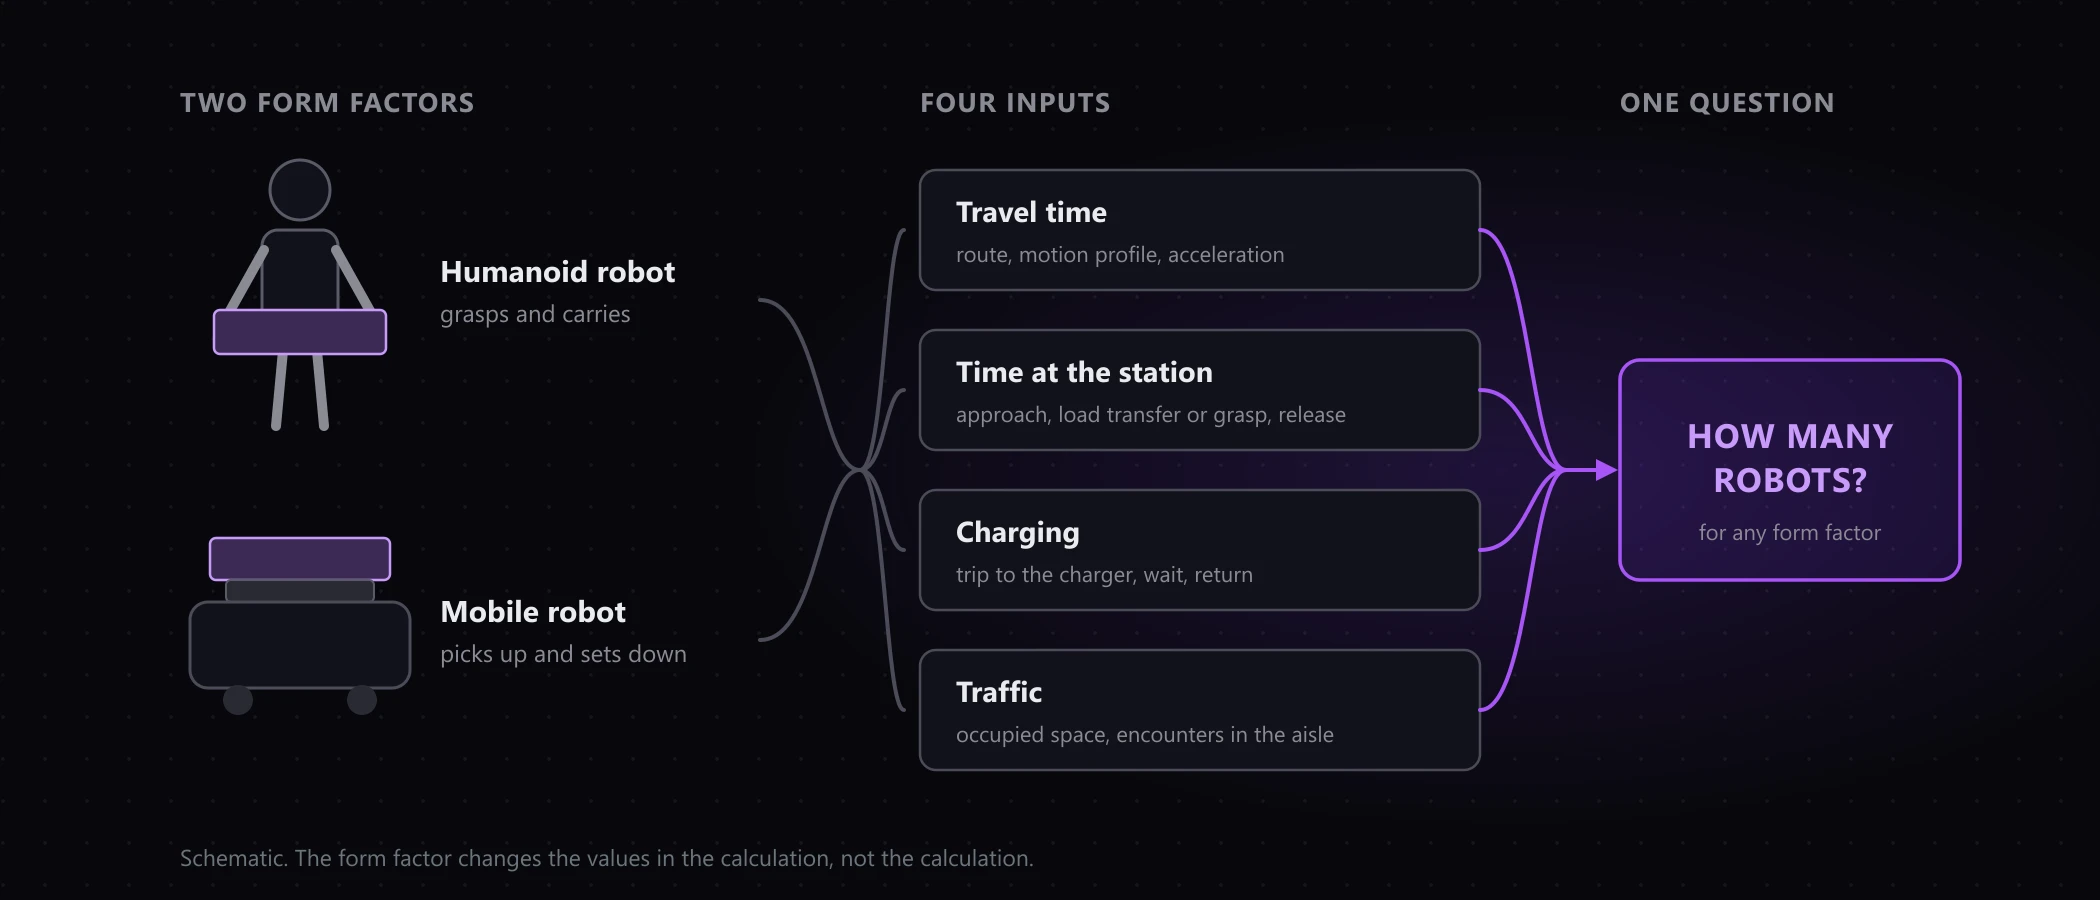
Almost every mobile robot project starts with the same question: how many robots do we need? The answer drives the investment sum, the throughput and ultimately the success of the project, and yet in many projects it is estimated rather than calculated. This article shows why static calculations regularly miss the mark for automated guided vehicle systems, and how simulation makes fleet size a defensible number before the first vehicle is ordered.
Where static calculations hit their limits
The classic back-of-the-envelope calculation looks plausible at first: transport orders per hour, average travel distance, vehicle speed. Out comes a fleet size. On paper, the math works. In operation, it doesn’t.
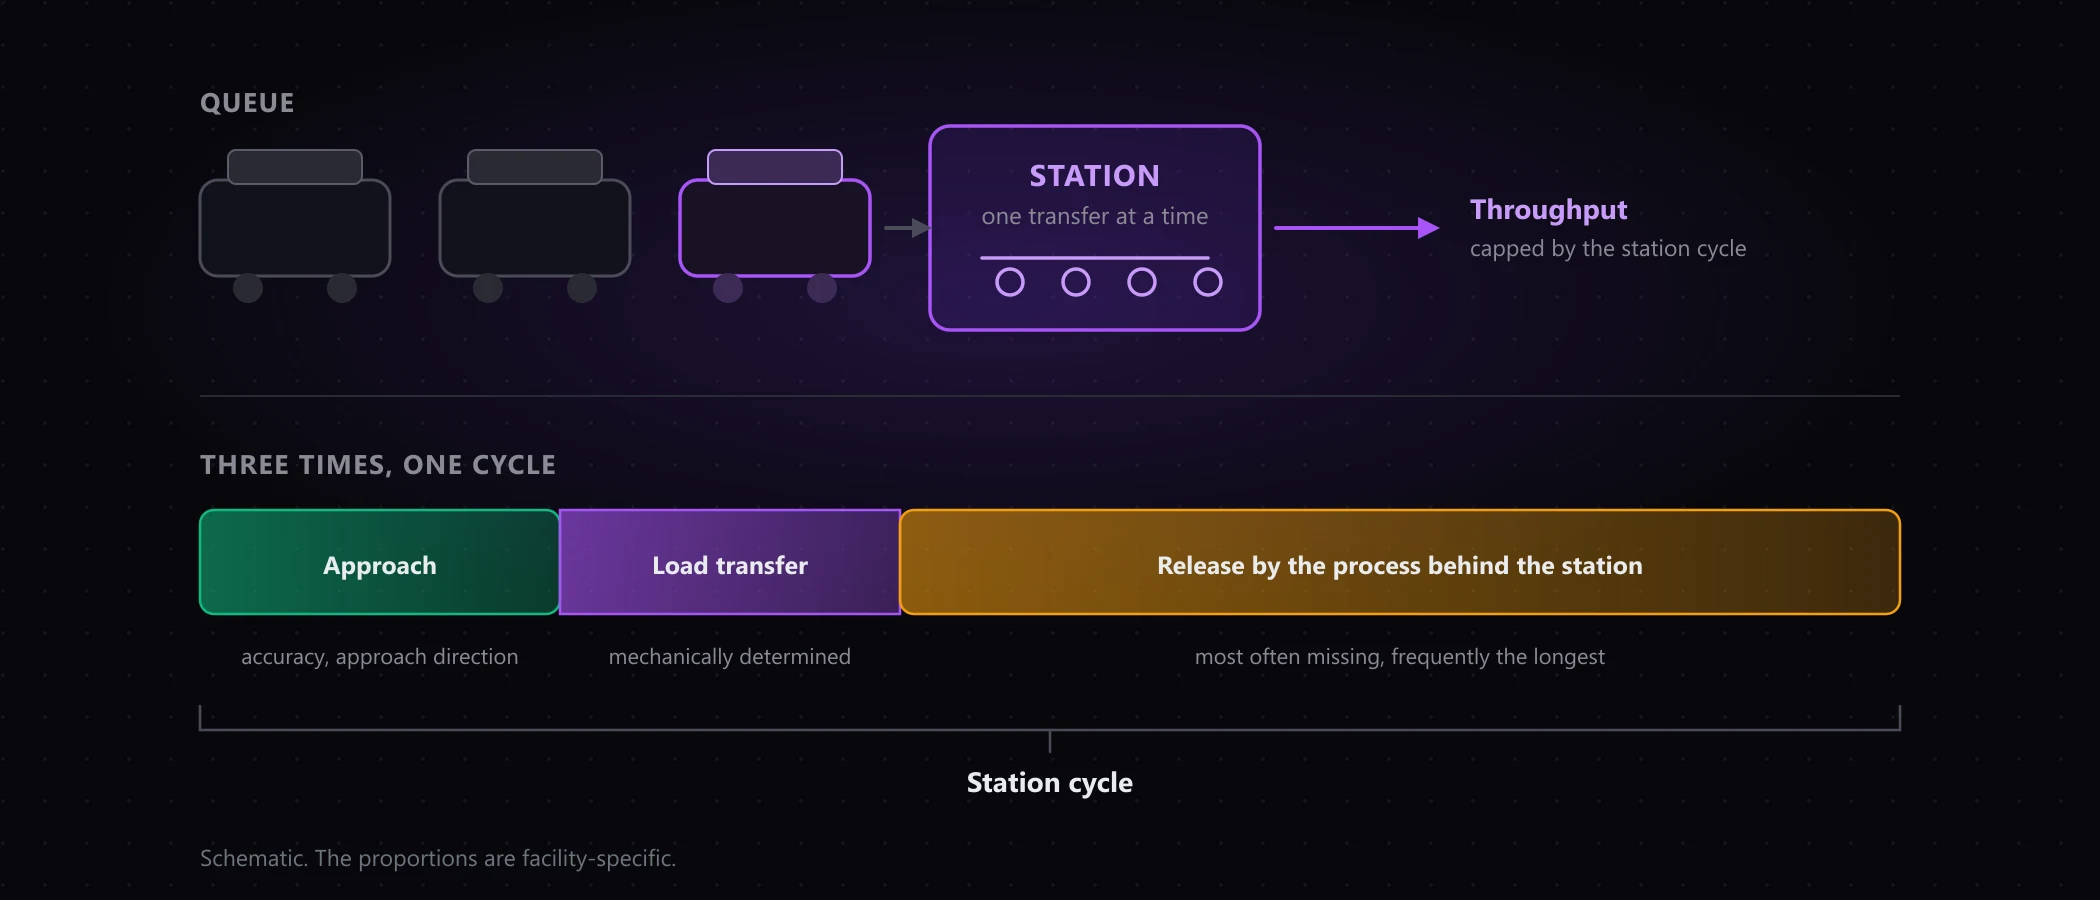
The reason: mobile robots don’t drive in isolation. They share paths, intersections and transfer stations. It is exactly these interactions that no spreadsheet captures:
- Blocking and waiting times: At bottlenecks and intersections, vehicles wait for each other. Every second of waiting reduces effective transport capacity, and the effect grows disproportionately with fleet size.
- Peak loads: The average says little about whether the fleet can handle the shift peak at goods-in. Systems must be sized for the peak, not the mean.
- Charging and availability: Charging windows, charging positions and battery models determine how many vehicles are actually available at the same time.
- Traffic rules in the layout: One-way paths, restricted zones and priority logic change real travel times considerably compared to a straight-line calculation.
Both directions of error are expensive: an oversized fleet ties up capital in vehicles that get in each other’s way. An undersized fleet costs throughput, and fixing it in live operation is far more expensive than any correction in the planning phase.
In short: A fleet size from a spreadsheet is a hypothesis. A fleet size from a simulation is a tested statement about your specific layout, your processes and your peak loads.
What a simulation answers
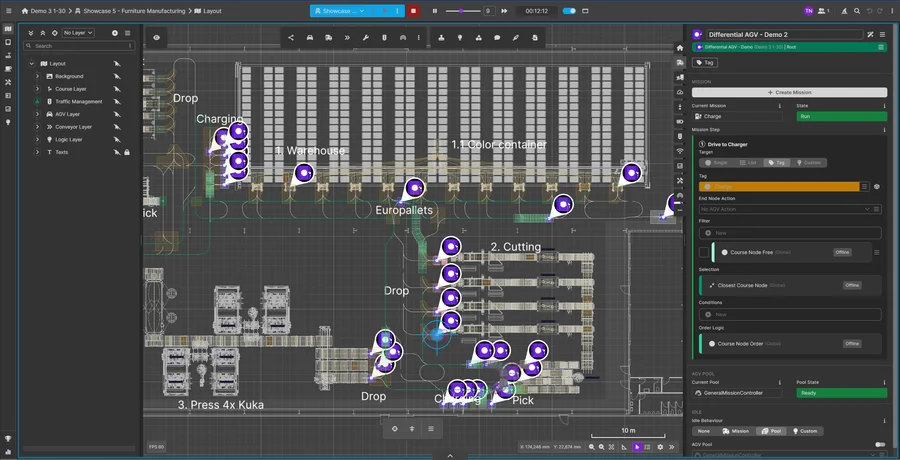
A simulation maps the layout, transport orders and vehicle behavior in a digital model and runs the operation before it exists in reality. That makes the questions answerable that static calculations fail at:
- Fleet sizing. How many vehicles does the system need for a defined throughput target? At what point does an additional vehicle stop adding value?
- Bottleneck analysis, Which intersections, paths or stations limit throughput? Where do queues form, before they cost real money?
- Layout variants, Which routing, which station arrangement works better? Scenarios can be compared directly.
- Charging and shift models. Are the charging positions sufficient? Does the fleet survive the peak hour without vehicles running empty?
- Failure scenarios. What happens when an area is blocked or a vehicle drops out?
The result is a set of KPIs that justify an investment decision. Towards management as much as towards suppliers in a tender. Our project experience shows: teams that simulate before procurement avoid a significant share of the rework that otherwise follows go-live.
How a simulation project runs
The path to a reliable result is shorter than many expect:
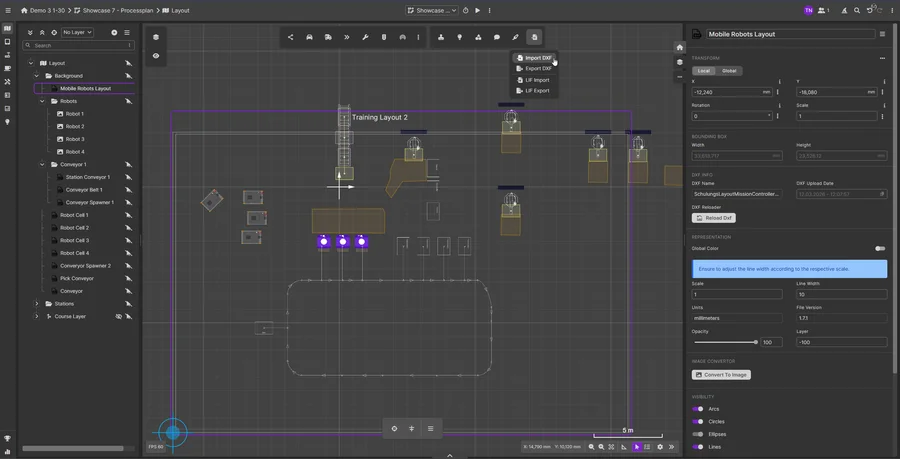
- Import the layout. The hall drawing usually already exists as a DXF file and is imported directly as the base layer instead of being redrawn.
- Define the path network. The route network is created on top of the plan: nodes, edges and corridors, including stations and traffic rules.
- Model the processes. Transport matrix, order profiles and shift models describe what the fleet has to deliver.
- Simulate scenarios. Fleet sizes, layout variants and load profiles run in comparison; throughput, utilization and waiting times are evaluated per scenario.
- Hand over the results. The outcome is a traceable report and a reusable simulation model, not a one-off presentation.
Important context: this type of simulation is graph-based: built on nodes, edges and corridors as described by the LIF and VDA 5050 standards. That matches how most intralogistics systems actually operate: even autonomous mobile robots typically run on virtual path networks, because free-roaming navigation makes throughput hard to predict. Freely navigating SLAM systems without a defined path network are explicitly not the use case.
Plan independently instead of being sold to
In many projects, the fleet size is supplied by the vehicle vendor. That number may well be correct, but it comes from the party that benefits when more robots are sold. Before an investment of this magnitude, an independent second opinion is worth having. One that is measured only against reliable numbers.
Vendor independence also means the planning is built on open standards. A layout in the LIF format stays usable: for tenders, for vendor comparison and for later operation, regardless of which manufacturer wins the contract. Our planning platform page shows the overall workflow; how the simulation works in detail is covered on the simulation page.
Conclusion
- Static calculations ignore interactions, and that is exactly where the expensive planning errors come from.
- Simulation makes fleet size, throughput and bottlenecks visible and comparable before the investment.
- Graph-based simulation per LIF and VDA 5050 matches how most real systems actually operate.
- A vendor-independent number is the solid basis for tenders and investment decisions.
If you are currently facing the question “how many robots do we need?”: in a free initial call we will clarify whether and how a simulation can de-risk your project: no strings attached, based on your specific facility.

About the author
Tim Nowak
Tim Nowak is co-founder and Managing Director of ScaliRo GmbH. He supports operators, manufacturers and integrators with vendor-independent planning and simulation of mobile robot fleets.
LinkedIn